Not long ago I shared a blog post entitled Calculate ROI of CX: a simple example where I used Customer Satisfaction (CSAT) as a Customer Experience metric and customer’s Average Spend as a business metric. Recently I was asked about the impact of another popular CX metric, Net Promoter Score (NPS), in the bottom line.
Most of you know that NPS measures the customer’s loyalty to the brand. It measures the customer’s “long-term” happiness, and tries to predict what customers will do in the future. And you also know that NPS is calculated by subtracting the % of Detractors, from the % of Promoters.

Measuring NPS, comparing your NPS to the competition’s, and bragging about a high NPS score might be fun. But in the end, it could be useless if you cannot show your senior leadership or C-suite how it impacts the companies bottom line.
Truth is loyalty means much more. Sure, you want customers to buy your product. But more than that, you want them to buy into your company – your values, your mission, and your care for each and every client – and when they do that, you will see a reflection in your NPS, and you will be well on your way to increased revenue and sustainable growth.
So, how do you prove your board that having a higher NPS impacts revenue and growth positively? You can start by stating that higher NPS scores usually result in 4 very tangible things:
- Higher Retention Rates
- Increased up-sell and cross-sell
- Lower cost to serve
- Lower marketing costs (due to word-of-mouth)
But let’s get to the fun part, of calculating the impact of NPS in the company’s revenue. So you can have some data and facts to backup your blurb. For this example I created a scenario of a company with 1 million customers, and used average spend as a business metric.
Let’s say that Promoters represent 54% of customers and spend $500 per year; And Detractors represent 14% of customers and spend $100 per year… NPS would be 40 and the revenue $348m

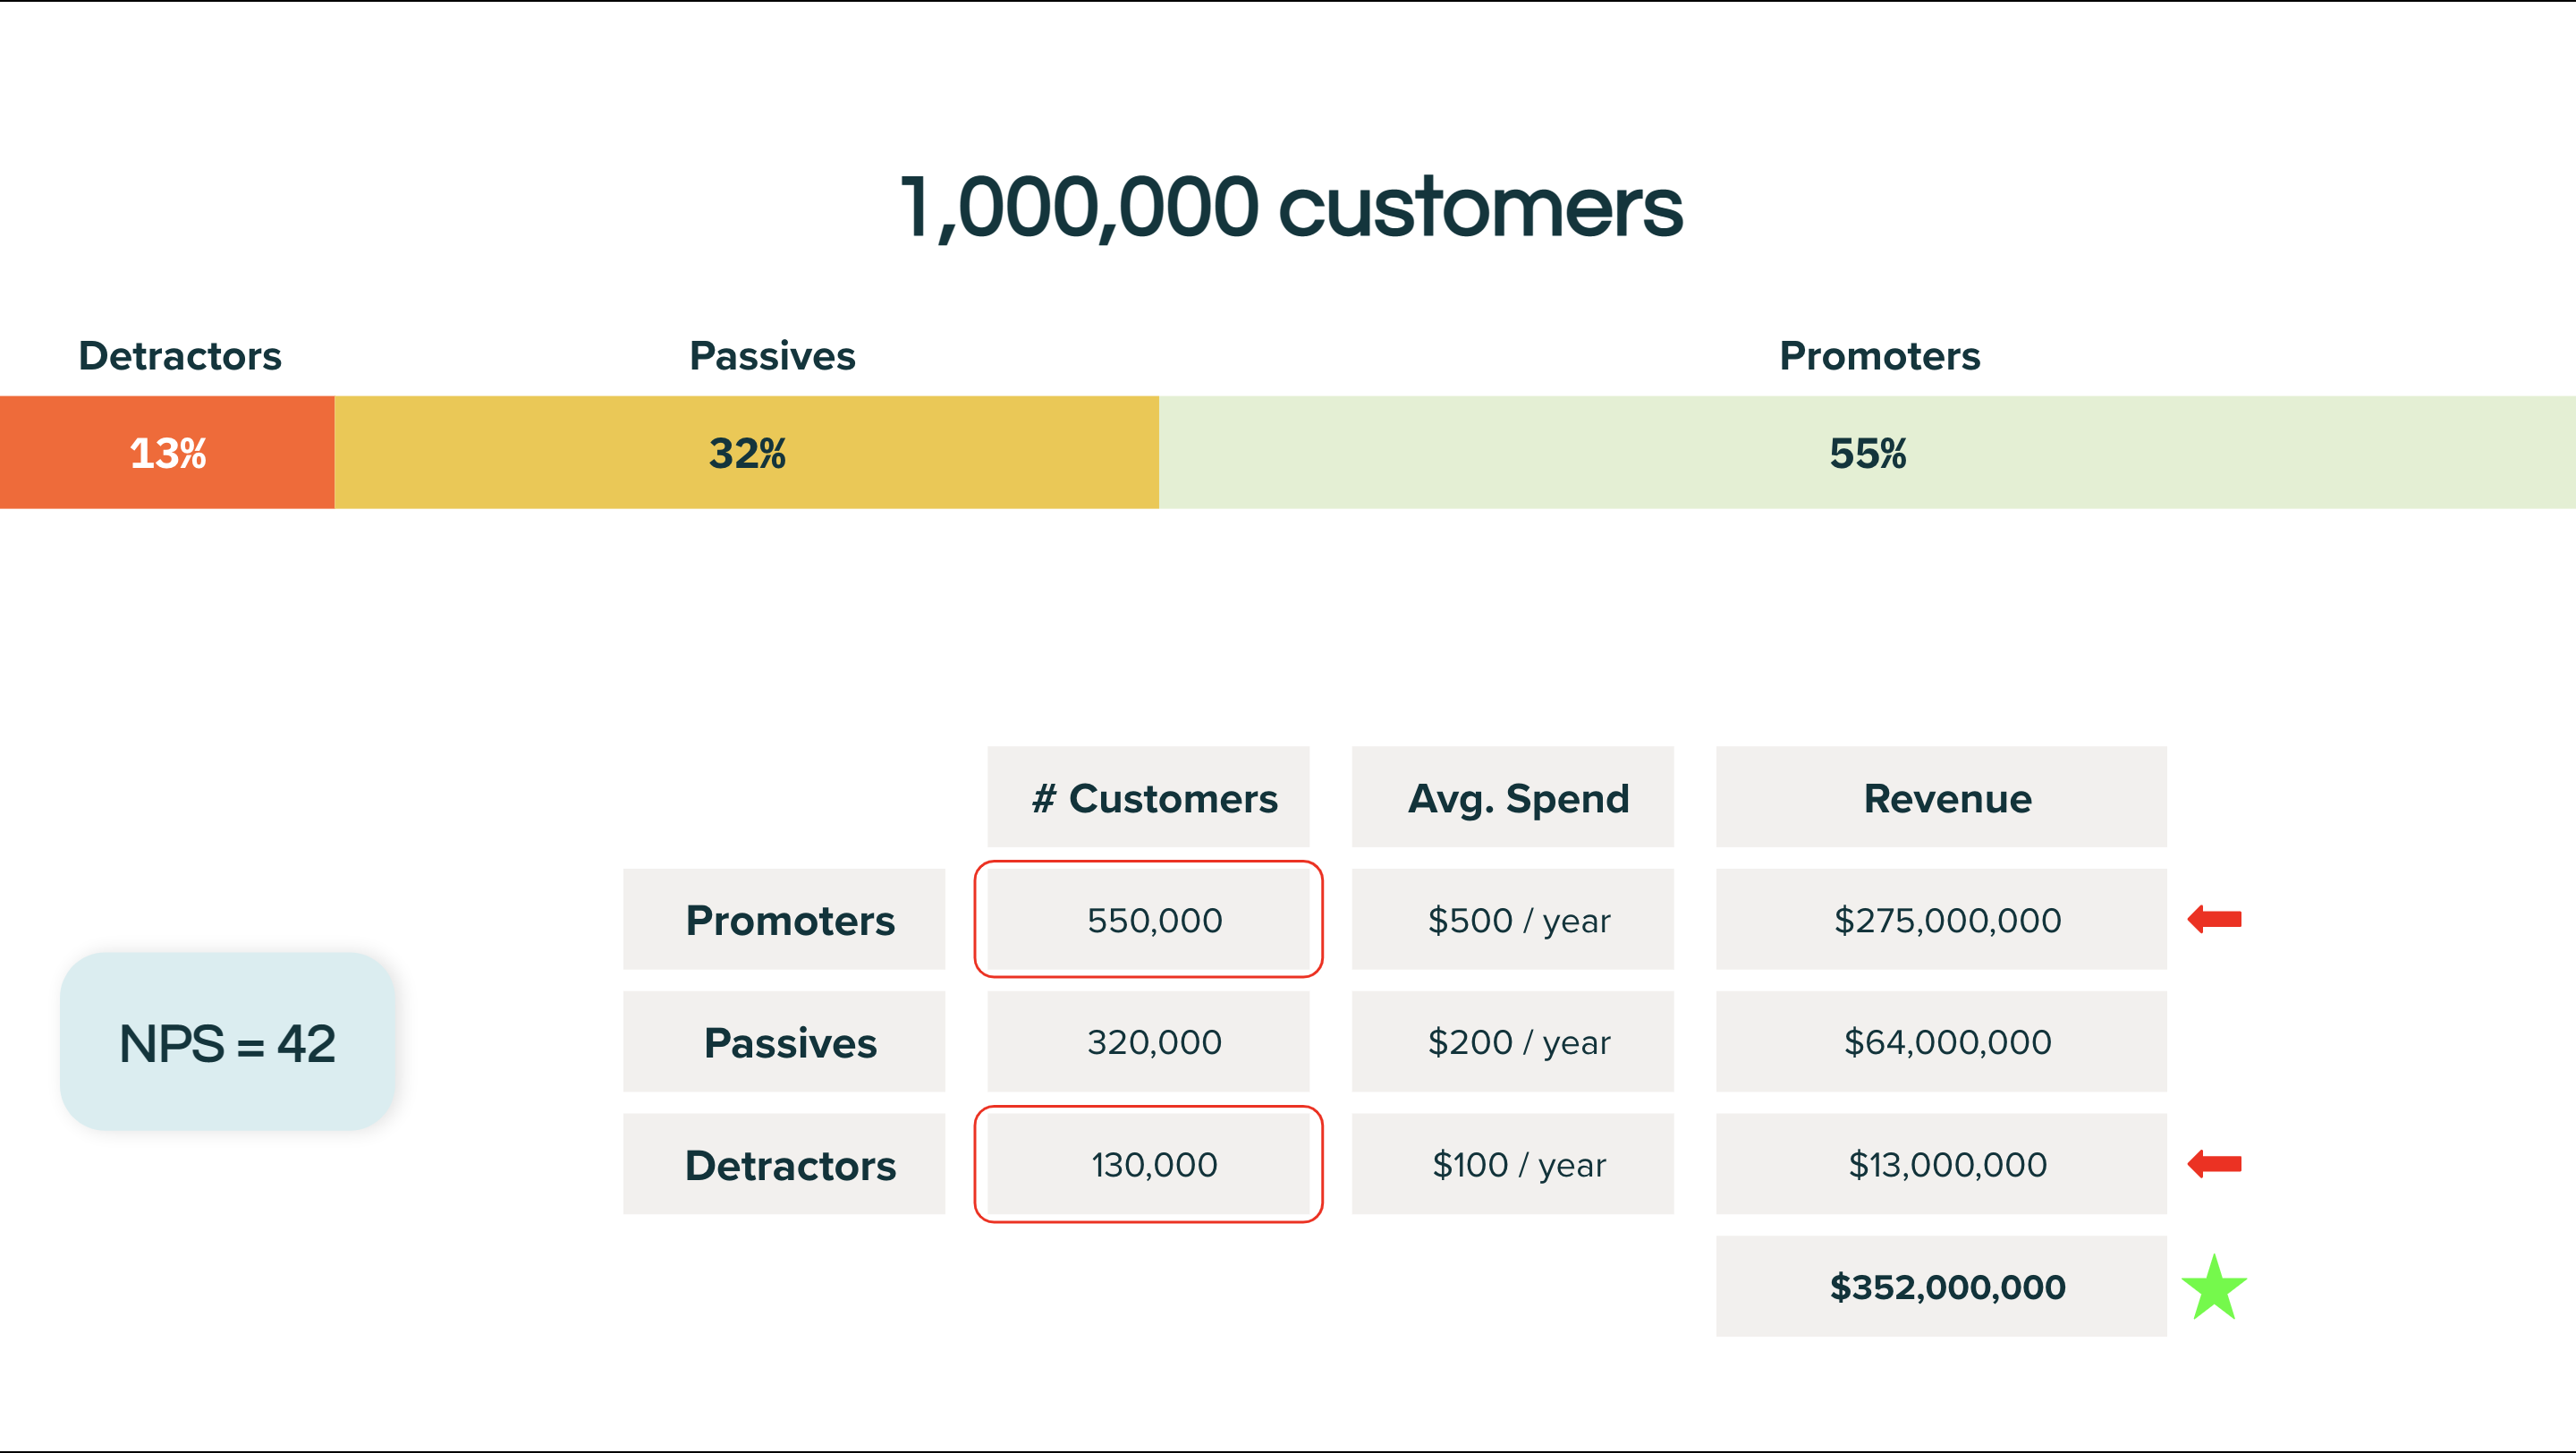
Now let’s say we were to convert 10,000 Detractors into Promoters… NPS would be 42 and the revenue $352m
Now let’s convert another 10,000 Detractors into Promoters… NPS would be 44 and the revenue $356m.

The correlation between NPS and revenue is obvious. And would allow us to conclude that by converting 3,75% of Detractors into Promoters, would move the NPS needle by 1 point, which would in turn increase the revenue by $2m in a year.

Note: An interesting study from Satmetrix shows that, among the various CX metrics, NPS has the highest correlation to profit and growth. You can also see from the chart below that CSAT seems to have the lowest correlation.