
The reporting features in RightNow CX are accessed through the RightNow Analytics explorers. From these explorers, you can create custom reports and dashboards, view standard and custom reports, and edit report styles, chart styles, colour schemes, images, and text fields to use with reports and dashboards.
Reports Explorer
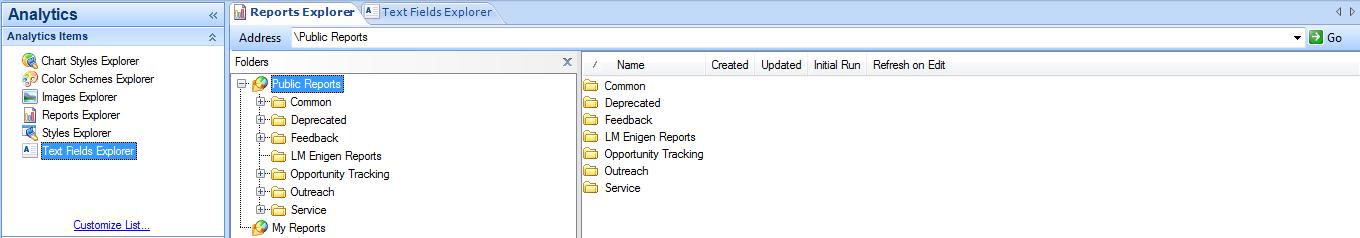
Reports are contained in folders in the Reports explorer. These folders are in a tree structure and can be expanded or collapsed to hide or display their contents. Reports that are accessible by multiple staff members are contained in the Public Reports folder, and private reports that are accessible only to the staff member who created them are stored in the My Reports folder.
Styles Explorer
Report styles allow you to quickly apply custom display settings to your reports without editing the underlying report. Styles can also help staff members use the same display settings for their reports so that all reports generated by your staff share the same appearance. You can easily create and edit styles to define the specific fonts, colours, borders, and margins which are most appropriate for your target audience.
You can edit style options for various components used in reports, such as text fields, column headers, exceptions descriptions, or entire report sections. You can also associate a custom chart style with your report style that will be applied to charts added to reports.
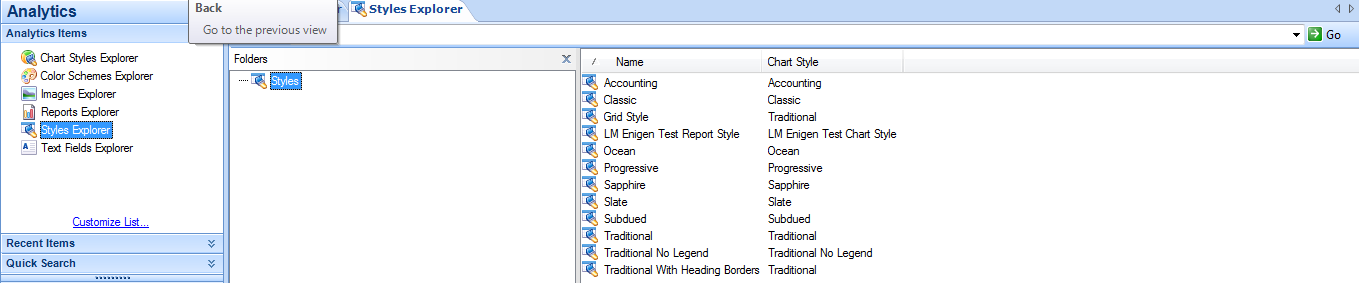
Chart Styles Explorer
RightNow CX lets you create chart styles to define the appearance of charts shown on reports. By applying a chart style, you can immediately change a chart’s fonts, colours, scales, grid-lines backgrounds, and other display attributes. The Chart Styles explorer includes several predefined chart styles, which you can apply to charts, and allows you to create custom chart styles. You can then apply the same chart style to charts in different reports to ensure that all the charts have a similar appearance.

Images Explorer
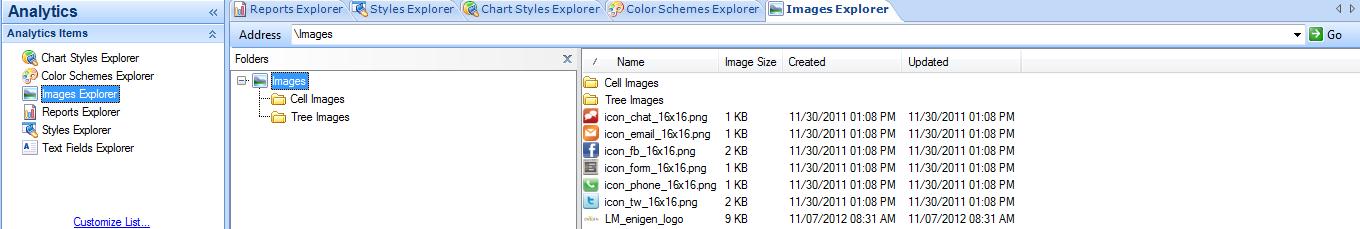
Photos and other images can be uploaded to use in reports and dashboards. For example, your organization’s logo can be added as an image and then added to custom reports.
The images used with reports and dashboards can be added and replaced using the Images explorer. The ability to replace images is helpful when an image, such as a corporate logo, is modified. Once the image file is replaced, the reports and dashboards with the old image automatically use the new image.
Text Fields Explorer
The Text Fields explorer lets you create text fields you can add to custom reports and dashboards. When you create a text field, you can specify the field’s text, fonts, borders, colours, and margins. You can also adjust these settings after you add the field to a report or dashboard.
For example, you could create a text field with your organization’s name, using your organization’s preferred fonts and colours, which you could add to your reports’ titles. Since the text fields can be edited once they are added to reports, you can also create a template text field with your customized settings and change the wording in the field as necessary.
![]()

Why when the report data has special characters like “>” is displayed so “>”?
spelling the end of the previous comment: special characters like “>” is displayed so “& g t ; “