Report on Bounced Marketing Emails (Mailings)

Oracle Service Cloud comes with several reports that allow the analysis of the emails sent to customers by the use of the Outreach facilities of the platform. Those out-of-the-box reports track the accuracy of email delivery and show activity and performance for both broadcast and transactional mailings.

They display the number of marketing emails that have been sent and delivered. The number of emails open, links clicked and unsubscriptions requested. The number and percentage of emails that could not be delivered. As well as the types of email bounces that prevented them from being delivered.

This information is grouped by Mailing. i.e. the user can select a particular Mailing and the report shows the above information for that specific Mailing.

This was not enough on one of the projects my team was working on. The requirement was not only to see the number of bounces, but actually be able to identify the name and email address of the person to whom the Mailing was not delivered.

By using a simple join between the Marketing Activities (ma_trans) and the Contacts (contacts) tables, we were able to deliver the report that showed the intended information. See report and definition below.

20150502 Oracle Service Cloud - Bounced Emails by Mailing

Report Definition: Oracle Service Cloud – Bounced Emails by Mailing

Outreach and Marketing: Campaigns

RightNow Outreach provides a powerful solution for building and managing dynamic, multiple-step marketing campaigns.

The intuitive campaign designer, allows the creation of campaigns as a flow diagram. Admins can easily design a campaign by dragging and dropping components/elements from the toolbox to the canvas.

In addition, it is possible for Admins to define objectives and budgets for the campaigns, as well as estimate expenses and ROI.

Once the campaign is launched, Admins can review its results and compare them against the estimates to evaluate the effectiveness of the campaign.

To create a campaign:

Step 1: Click the Campaigns button on the navigation pane and double-click Campaigns Explorer.

Step 2: Click the New button to select a starting point for your new campaign.

  • Click Blank Campaign to open a new campaign with a blank design canvas
  • Click Choose Existing Campaign to create a new campaign by copying the design of an existing campaign
  • Click Choose a Campaign Template to create a new campaign by copying a campaign template

RNMKT1

Step 3: Click the Details button to manage campaign details, including assignment, start and end dates, and objectives.

RNMKT2Step 4: Click the Results button to view the campaign results (this report will display no data until the campaign has been launched).

Step 5: Click the Tasks button to add tasks to the campaign.

Step 6: Design the flow diagram of your campaign.

The flow diagram will be the graphical representation of the steps, actions and decisions the campaign will perform, and the order in which it will perform those.

Before starting the design, it is advisable that Admins know the elements available in the toolbox and consider how each of them will help accomplish the campaigns’ key objectives.

After inserting each element the Admin can double-click on it to open a window where attributes of that element can be edited or defined.

RNMKT3

To create a flow diagram perform the following three steps:

Step 6.1: Drag and drop the elements from the toolbox onto the canvas.

Event Triggering Elements: Serve as starting points for campaigns

  • Serve Web Page
  • Broadcast Mailing
  • Scheduled Entry Point
  • Entry Point

 Standard Elements: Perform actions when specified criteria are met.

  • Add to List
  • Transactional Mailing
  • Set Field
  • Opportunity
  • Notification
  • Transactional Survey
  • Redirect to URL
  • Lead
  • Incident
  • External Event

 Artifacts: Comments about the campaign. Do not affect the outcome of the flow diagram.

  • Comment

 Conditional Elements: Produce multiple path outcomes based on decisions.

  • Case Statement
  • Decision

Step 6.2: Connect one element to another. To do that just click an anchor on the first element and drag the connector to an anchor on the second element. The anchor is highlighted when the connector is able to link to it. The connector arrow will point from the first element to the second.

Connectors are components used to link elements and indicate flow direction. Elements can be connected to other elements depending on their type. The type of connectors are:

  • Yes (Green): links a decision element to another element. The path is taken if the contact meets the criteria specified in the decision.
  • No (Red): links a decision element to another element. The path is taken if the contact does not meet the criteria specified in the decision.
  • Standard (Gray): links one element to another element. The second action is performed immediately after the first
  • Artifact (Black, Dashed): links a comment to an element.
  • Submit (Blue): submits an element’s web form fields to the database and links to another element. A web form can be a document with a web form or survey questions
  • Case (Gray): links a case statement element to another element. The path is taken if the contact meets the criteria specified in the case statement.

 Each element can have a specific number of incoming and outgoing connectors.

Step 6.3 (Optional): Change the formatting of an element. Cut, copy, or paste one or more components. Export an image of the canvas to your workstation by clicking the CX button and selecting Export Image.

Outreach and Marketing: Creating Audiences

RightNow provides two methods for grouping contacts to create audiences to use on broadcast mailings or surveys:

  • Contact lists: Static lists comprised only of contacts that have been explicitly selected, changing only when you manually add or remove contacts.
  • Segments: Dynamic lists comprised of contacts that match one or more fixed filters that you specify. Because segments are dynamic, their contents change over time as updated contacts fall in and out of alignment with the filters.

When you create a mailing or survey, contact lists and segments can be used alone or included with (or excluded from) other lists and segments to form your audience. This gives all the flexibility needed to assemble audiences that are specific, optimized, and efficiently maintained.

Creating a Contact List:

1. Click the Audiences button on the navigation pane
2. Double-click Contact Lists Explorer

audiences1

3. Click the New button
4. Enter information in “Notes” field
5. Tick/un-tick “Available for Proof” field (let contacts in the list receive proof requests)
6. Tick/un-tick “Remove Contacts from Old List” field (let contacts stay in contact lists for longer than the time frame set in the database)

audiences2

7. Add contacts to the list on the Contacts tab

audiences3

Note: You can select multiple contacts by pressing Ctrl while clicking additional contacts. Selected contacts that are already in the list are not added again.

audiences4

8. Click the Save and Close button to save the contact list
9. Select the folder you want to save the contact list in and type the name of the contact list.

From the Contacts tab of the contact list editor, it is possible to add existing contacts to the list or create new contacts and add them to the list. It is also possible to search the list of contacts, remove contacts from the list, or edit contact records.

While contact lists are created by manually adding contacts to a static list, segments are dynamic lists of contacts created by defining contact criteria and selecting filters. When you create a segment, you can filter using any field in the contacts table, including custom fields, and by joining the contacts table to other tables.

Once you create a segment, it can be used in mailings and surveys and the group of contacts is constantly adjusted and updated as contact data meets or falls outside of the segment’s requirements.

Creating a Segment:

1. Click the Audiences button on the navigation pane
2. Double-click Segments Explorer

audiences5

3. Click the New button on the ribbon
4. To create a segment from scratch, click New Segment

audiences6

5. Enter field information to define the segment’s filters on the Criteria tab. Use the Data Dictionary on the left-hand side or Add Filter in the options on the sections on the right-hand side.

audiences7

Whenever a field is dragged/dropped from the Data Dictionary or a filter is added/edited an Edit Filter window opens for you to define the criteria.

audiences8

Filters are shown on the Criteria tab window and can be grouped.

audiences9

6. To preview the contacts belonging to the segment, click the Preview tab.

audiences10

7. Click the Save and Close button to save the segment has been performed.
8. Select the folder you want to save the segment in and type the name of the segment
9. Click the Save button to save the segment.

Analytics: Dashboards

When viewing standard or custom reports, you generally open reports one at a time, and search for data in only the report that is active. However, you can view and search for data in several reports simultaneously by adding them to a dashboard. Each report in a dashboard retains the same functionality as if you opened the report separately, allowing you to access and work with a variety of data from one dashboard.

Dashboards are particularly useful for managers who need to view a wide range of data from different reports. Using dashboards eliminates the need to open a large number of reports individually. Using dashboards eliminates the need to open a large number of reports individually.

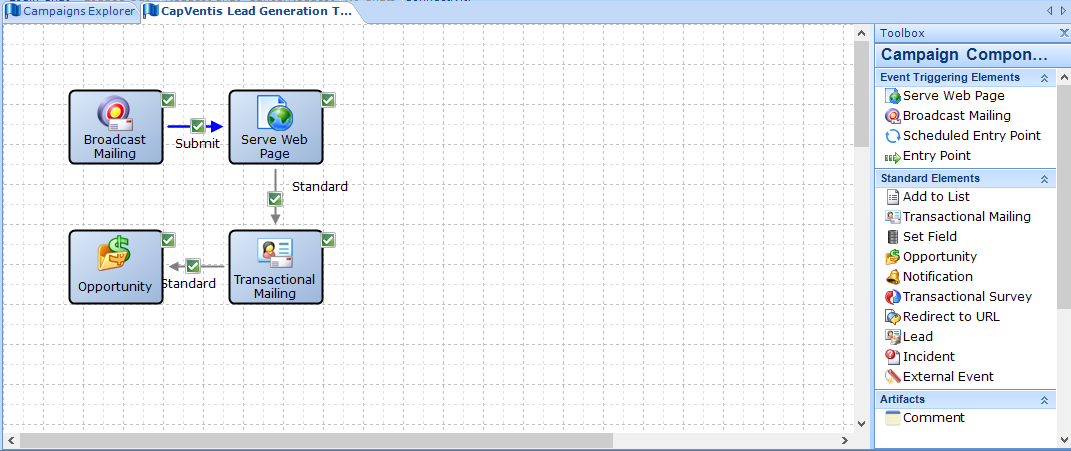
Dashboards are created and edited on the dashboard design centre by dragging reports to the dashboard, adding optional descriptions, images, text, and controls, and configuring display options.

To open the dashboard design centre:
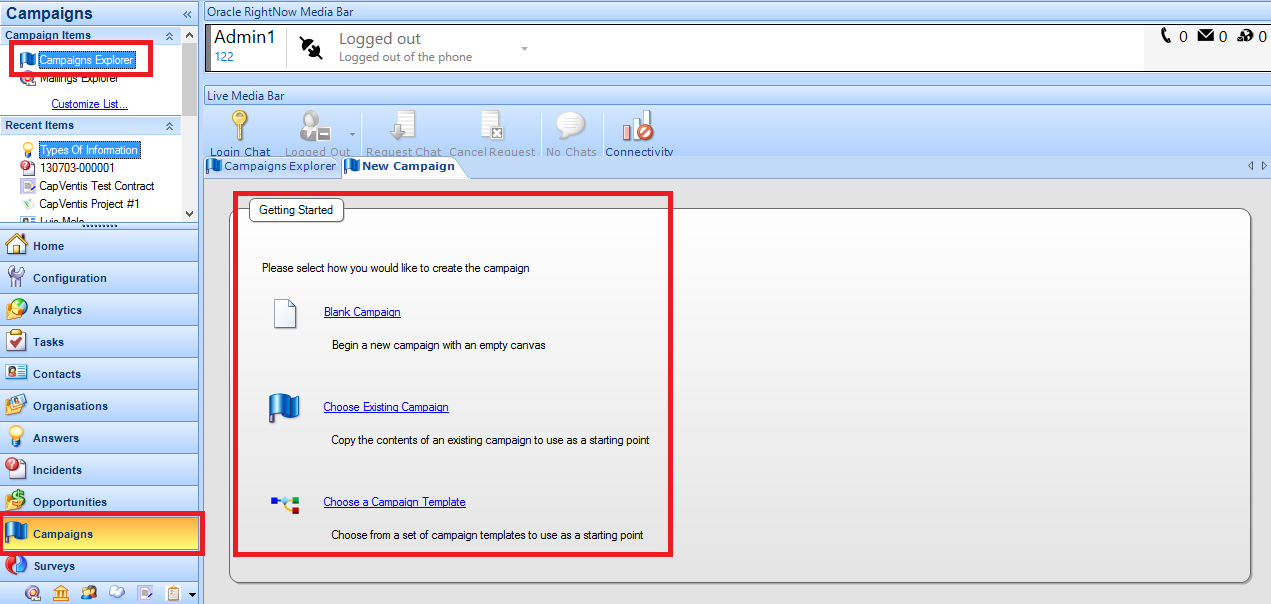
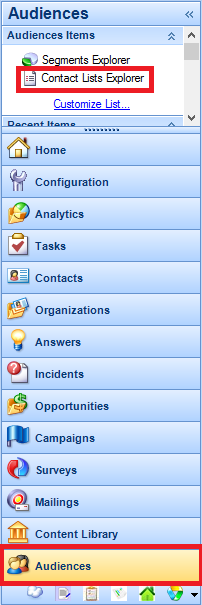
1. Click the Analytics button on the navigation pane.
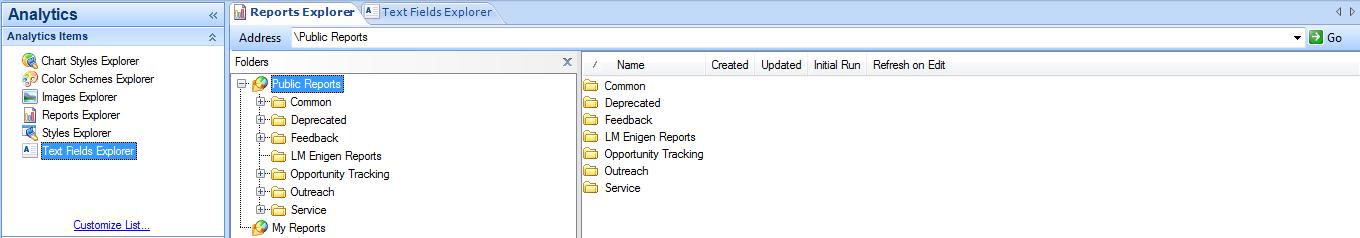
2. Double-click Reports Explorer.
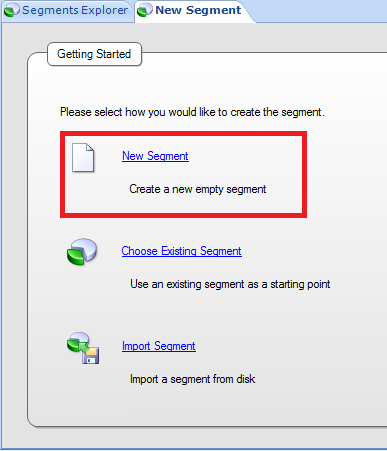
3. Click the New Dashboard button to create a dashboard.

The following image shows the dashboard design centre.

img6

You can also add tabs to the dashboard to place additional reports and other content that may not fit on the dashboard’s main page. Each dashboard can have a maximum of 50 items placed on it.

If you add private reports to a dashboard, other staff members can view the reports when they open the dashboard.

Dashboard options allow you to select the time zone that should be used for the reports in the dashboard, change the dashboard owner, and modify settings that impact how the dashboard functions when it is opened for viewing. You can also configure automatic refresh of the data shown in the dashboard’s reports, select data source options, add notes to the dashboard, change the image displayed for the dashboard in report lists, and schedule the dashboard to be sent in an email.

You open dashboards just as you would open a regular report from the Reports explorer or one of your navigation lists. Dashboards can also be opened from links you add to reports. When you open a dashboard, it loads with current report data. You can also queue dashboards to view them at a later time.

The dashboard includes options similar to those accessed from the Report tab when viewing a report. The dashboard also includes docked filters that are common to the reports in the dashboard and may include tabs to access reports on other dashboard pages.

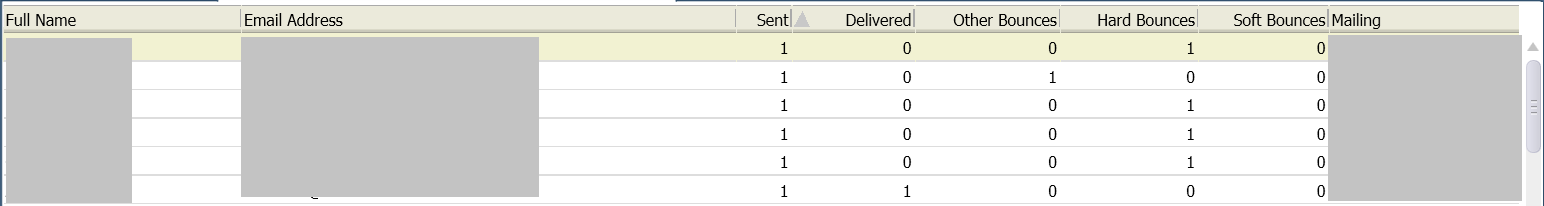
Since every report in a dashboard is fully functional, you can access the standard options available when viewing a report to sort columns, show or hide columns, and add column calculations. If the report and the permissions allow it, you can also access records listed in the reports or edit them inline.

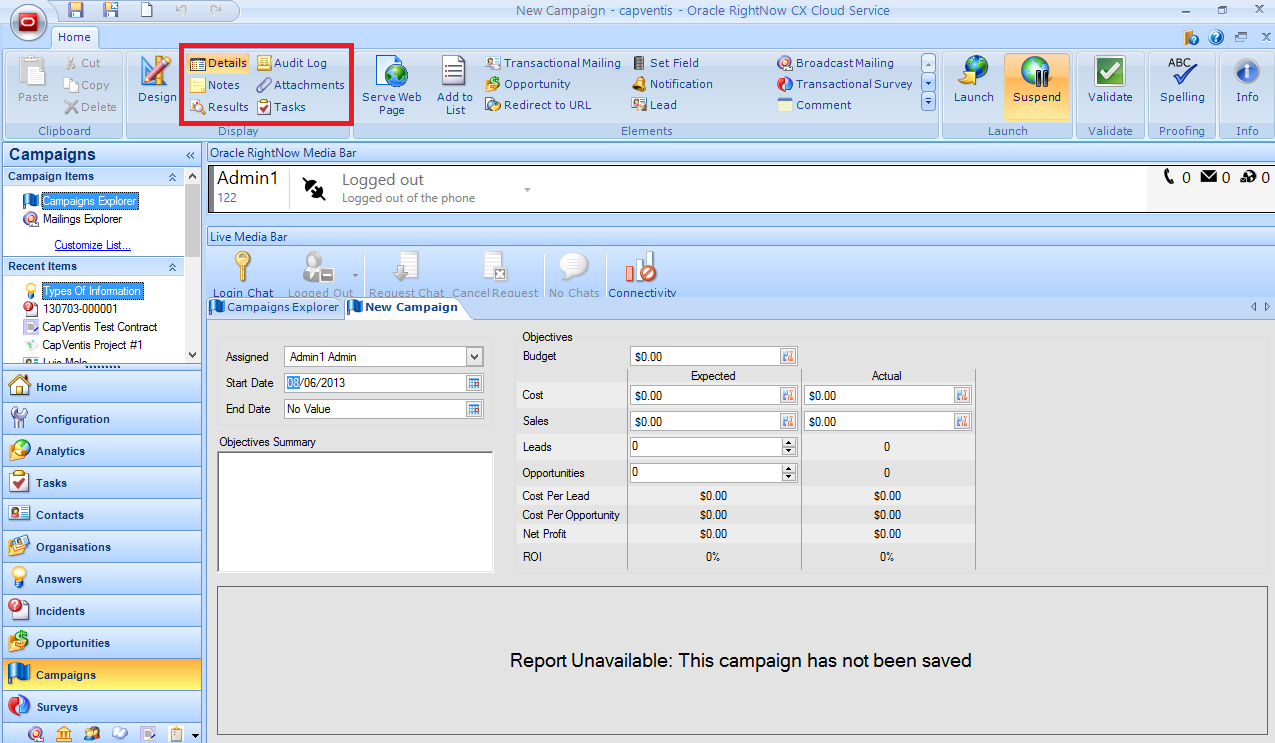
When you open a dashboard, the dashboard’s ribbon includes Home and Page Setup tabs. You can use the options on these tabs to print the dashboard and adjust the dashboard’s display and output. When you select an individual report on the dashboard, the ribbon is updated to include additional tabs containing options for modifying the selected report.

The buttons available on the Home and Page Setup dashboard tabs let you open the Search window, refresh the display, select display options, forward the dashboard, configure print options, and perform other actions that impact the entire dashboard.

Dashboards can be queued to run at a later time just as reports can. Dashboards can be manually queued or automatically queued. Once a queued dashboard generates, you can view the dashboard using a standard report or a notification just as you can with queued reports. You can queue dashboards containing reports that you think may query or return large amounts of data. This is also helpful if you want to view a number of dashboards but do not want to wait for each to generate.

After you queue a dashboard, you can use standard reports located in the Reports explorer’s Public Reports > Common > Site Administration > Reports folder to see the dashboard’s status in the queue. Once the dashboard runs and is ready to view, you are notified and you can open it from several locations.

Analytics: Introduction to Analytics Explorers

The reporting features in RightNow CX are accessed through the RightNow Analytics explorers. From these explorers, you can create custom reports and dashboards, view standard and custom reports, and edit report styles, chart styles, colour schemes, images, and text fields to use with reports and dashboards.

Reports Explorer
Reports are contained in folders in the Reports explorer. These folders are in a tree structure and can be expanded or collapsed to hide or display their contents. Reports that are accessible by multiple staff members are contained in the Public Reports folder, and private reports that are accessible only to the staff member who created them are stored in the My Reports folder.

img1

Styles Explorer
Report styles allow you to quickly apply custom display settings to your reports without editing the underlying report. Styles can also help staff members use the same display settings for their reports so that all reports generated by your staff share the same appearance. You can easily create and edit styles to define the specific fonts, colours, borders, and margins which are most appropriate for your target audience.

You can edit style options for various components used in reports, such as text fields, column headers, exceptions descriptions, or entire report sections. You can also associate a custom chart style with your report style that will be applied to charts added to reports.

img2

Chart Styles Explorer
RightNow CX lets you create chart styles to define the appearance of charts shown on reports. By applying a chart style, you can immediately change a chart’s fonts, colours, scales, grid-lines  backgrounds, and other display attributes. The Chart Styles explorer includes several predefined chart styles, which you can apply to charts, and allows you to create custom chart styles. You can then apply the same chart style to charts in different reports to ensure that all the charts have a similar appearance.

img3

Images Explorer
Photos and other images can be uploaded to use in reports and dashboards. For example, your organization’s logo can be added as an image and then added to custom reports.

The images used with reports and dashboards can be added and replaced using the Images explorer. The ability to replace images is helpful when an image, such as a corporate logo, is modified. Once the image file is replaced, the reports and dashboards with the old image automatically use the new image.

img4

Text Fields Explorer
The Text Fields explorer lets you create text fields you can add to custom reports and dashboards. When you create a text field, you can specify the field’s text, fonts, borders, colours, and margins. You can also adjust these settings after you add the field to a report or dashboard.

For example, you could create a text field with your organization’s name, using your organization’s preferred fonts and colours, which you could add to your reports’ titles. Since the text fields can be edited once they are added to reports, you can also create a template text field with your customized settings and change the wording in the field as necessary.

img5

Feedback: Create Surveys

Once you have defined the questions you want to ask, you can easily present them to your audience in surveys. RightNow Feedback contains flexible tools for creating custom surveys in a variety of formats. Surveys can be:

  • Sent as mailings
  • Served as web pages
  • Sent as events triggered by a campaign or business rule.

With a wide range of formatting and customization options and full analytics integration for tracking results, surveys provide you with a powerful channel for inviting, gathering, and analysing customer feedback.

You can create four types of surveys, distinguished by invitation method:

  • Broadcast surveys are used to send broadcast invitations to specified audiences at a time you choose.
  • Transactional surveys send invitations triggered by events that you define, such as an incident resolution or a campaign action.
  • Website link surveys rely on separate invitation delivery mechanisms, such as a link to the survey placed on a web page.
  • Polling surveys display as a single question on a customer portal page or any page that is external to the customer portal, such as a “Poll of the Day”. After customers submit their response, they see a poll results chart or a thank-you message.

Although available features vary by invitation method, every survey is presented through a web page and can be linked to from outside of RightNow CX. With the exception of polling surveys, surveys can be added to workspaces, letting your agents complete surveys by proxy (on behalf of contacts) during telephone interactions.

To create a survey

1. Click the Surveys button on the navigation pane and double-click Surveys Explorer.

2. Click the New button on the ribbon. A new survey opens on the content pane.

imga

3. Choose the type of survey (in this case we will select Broadcast Survey).

imgb

4. To let customers answer the survey anonymously, select the Allow Anonymous check box.

5. To let customers submit the survey more than once, select the Allow Multiple Submissions check box.

6. Use the At a Glance section to perform common survey functions

7. Click the Questionnaire tab to add questions and HTML content to the survey.

imgc

8. Click the Audience tab to define an audience for the survey

imgd

9. Click the Invitation Message tab to create the message sent to the survey audience

imge

10. Click the Proofing tab to send a proof of the email for internal review before sending it to the entire audience

imgf

11. Click the Delivery tab to select delivery options

imgg

12. Click the Results tab to view the report associated with the survey

imgh

13. To preview the survey, click the Preview Survey button on the ribbon. The survey preview opens in a web browser

RightNow Feedback: Feedback Questions

In order to create surveys in RightNow Feedback, you must first create the questions that your respondents will answer. You can choose different question types to gather responses of different qualities, and you can customize display characteristics of each question.

For example, you can provide space for your respondents to enter their answers in their own words, returning data that is often specific and insightful. Alternately, you can offer respondents a choice of prewritten answers to a question, which provides you with a consistent, easily interpreted data set. You can also score choice questions and use RightNow Analytics to evaluate responses as numerical values.

When you create a survey question, you define the question name, type, and text that respondents see on the survey. You can also assign a score to each question choice. When creating questions, you can choose from three question types.

  • Text questions – Text questions let respondents type their answer to the question. You can create text questions when you want your respondents to be able to answer in their own words without having to choose from predefined options (e.g. “Do you have any suggestions?”). When you create a text question, you define only the question and the available space the respondent has to answer.
  • Choice questions – Creating choice questions lets you define the available responses for the question, allowing respondents to choose their answer from a menu, radio button, check box, or list. Choice questions may be scored and evaluated in Analytics.
  • Matrix questions – In cases where a series of questions can be responded to with the same set of answer choices, matrix questions can help streamline a survey’s appearance by grouping the questions together in a table. Answer choices are displayed using either radio buttons (to permit only one answer to each question) or check boxes (to allow more than one answer). If you choose radio buttons, you can restrict selections to one choice per row, forcing respondents to rank their answers.

To create a question:

1. Click the Surveys navigation button and then double-click the Questions Explorer on the navigation list.

2. From the Questions Explorer, click the New button. A new question opens on the content pane.

img1

3. Type the text of the question in the Question Text field. This will be the question you want the respondent to answer.

4. Select the Question Type on the drop-down menu.

4.1. If “Text“ question type is selected you can make the question required or not, and control the number of characters the customer can use to respond, the number of lines displayed in the answer field, the width of the answer field or if there will be a real time character count displayed.

img2

img3

4.2. If “Choice“ question type is selected you can define how the choices are going to be displayed (Radio, Check box, Menu, List), the Respondent Selections (Required, number of choices, etc.), and add the choices. It is also possible to give score to the each choice in order to use analytics afterwards.

img4

img5

4.3. If “Matrix“ question type is selected you can define how the choices are going to be displayed (Radio, Checkbox), the Respondent Row Selections (Required, number of choices, etc.), add the questions and choices. It is also possible to give score to the each choice in order to use analytics afterwards.

img6

img7